After weeks of range-bound movements, the LPT has experienced a steep upsurge, changing sentiment on the broader altcoin markets. Livepeer (LPT), which is currently trading at $11.77 has risen more than 110% within 48 hours. Traders are asking why the LPT price is rising, and if this rally will continue into June.
What’s happening with LPT’s price?
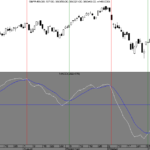
The LPT price action in the past 48-hours reflects a clear breakout of a multiweek symmetrical triangular pattern visible on both the 4-hour and daily charts. The breakout above the $6.50 – $7.00 resistance zone coincided high volume, triggering an intraday move that reached a high of $14.32.
The current price levels are consolidating at just under $12.00. This suggests that profit-taking has begun after the parabolic movement. The underlying structure is bullish, as long as LPT remains above the psychological $10.00 mark. Short-term support has been established at $10.40. Immediate resistance is at $13.70, and the major resistance is at $16.00.
Momentum Indicators Reflect a Hot, But Constructive Setup
On the 30-minute timeframe RSI has cooled off from overbought terrain and now hovers at 52.15. This allows room for a second leg higher. The MACD line is lower than the signal line which indicates a bearish momentum. The histogram, however, shows a declining bearish trend. This suggests the possibility of a crossover to the bullish side.
After a short reset, the Stochastic RSI is now moving upwards again. Values are now approaching the midline. The Chande Momentum Oscillator is still negative at -18.32, but it has recovered from oversold levels. This indicates neutral short-term movement. These mixed readings indicate that the price may oscillate in a tight range before a clearer trend emerges.
Bollinger and Ichimoku bands hint at price compression
Ichimoku Cloud Analysis on the 30-minute Chart shows the price stabilizing just below the cloud. The baseline (Kijun Sen) is at $11.29, and the leading span A is trending upward. This indicates that underlying bullish power is still present even if temporarily paused.
Bollinger Bands have started to narrow in the lower timeframes following the explosive volatility. The mid-band at $10.40 is an important level to monitor, and any retest which holds could reinitiate the upward movement. Traders will also want to note that the price is still well above the 200 EMA. This reinforces the breakout’s strength.
LPT Price Update – Short-Term Trend is Still Bullish
Zooming out on the daily chart, LPT’s price spikes have returned the asset to a previous resistance zone from earlier this year. The long-term downward trend appears to be decisively broken. A higher high has now been confirmed. A healthy pullback or consolidation in the sideways direction is expected before any further extension towards the next major goal at $16.70.
The key question is now LPT price volatility. Can bulls maintain momentum without a significant corrective? As of now, the short-term price structure is intact above $10, and bulls could attempt another push towards the $13.50-$14.00 area if momentum returns.
Forecast Outlook for the 1st of June and Beyond
LPT may remain in a consolidation stage for the first week of the month, unless it is strongly rejected from the $13.70 mark. Any confirmed break above $13.70 would expose the $16.00-$17.00 area, while a fall below $10 could reintroduce a weakness towards $8.40.
Technical Forecast Table for the 1st of June
|
Indicator / Level |
Observation/Value |
Bias |
Notes |
| Current Price | $11.77 | – | As of the 4H candle close |
| Short-Term Resistance | $12.90 – $13.77 | Bearish | Recent price spikes have impacted on key supply zones |
| Immediate Support | $10.40 – $10.00 | Neutral | Minor cushion; price test this on pullback |
| Trendline Support | $6.67 (base daily rising) | Strong Bullish | Long-term ascending support intact |
| RSI (30 min) | 52.15 | Neutral | Cooling down after an overbought rise |
| MACD (30-min). | Bearish crossover, -0.12 | Bearish | Histogram in red: downward momentum increasing |
| Bollinger Bands (4H) | $7.53 (lower) – $12.90 (upper) | Volatile | Wideband spread confirms breakout volatility |
| Ichimoku Cloud (30 min) | Price inside the cloud | Cautious Bullish | If the price remains above $11.74, a trend recovery is possible. |
| Chande Momentum (30-min) | -18.32 | Bearish | Weak momentum and currently recovering |
| Stoch RSI (30-min) | 47.79 & 27.97 | Bullish Cross | Potential upside if the crossover is sustained |
LPT price is one of the altcoins that has seen a notable breakout this week. The structure is in favor of higher levels, even though near-term volatility could shake out weak hands. Traders need to pay attention to how the price reacts between $12.00 and $14.70. Any clean break could be the beginning of a new surge.
This site is for entertainment only. Click here to read more